The Case
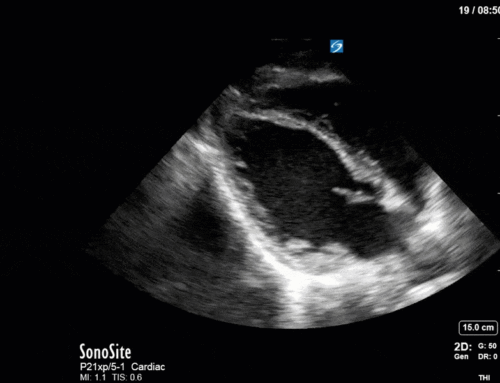
This is 65 yo M who presented with acute hypotension, hypoxia, and worsening AKI in the setting of known severe pulmonary hypertension secondary to a previous PE (CTEPH). He was admitted to the ICU for consideration of CRRT and IV flolan. A few days into his admission, the team asked for a POCUS cardiac assessment to reassess the status of his RV. Have a look the images below. Specifically, what do you think about the tricuspid regurgitation and estimated RVSP?
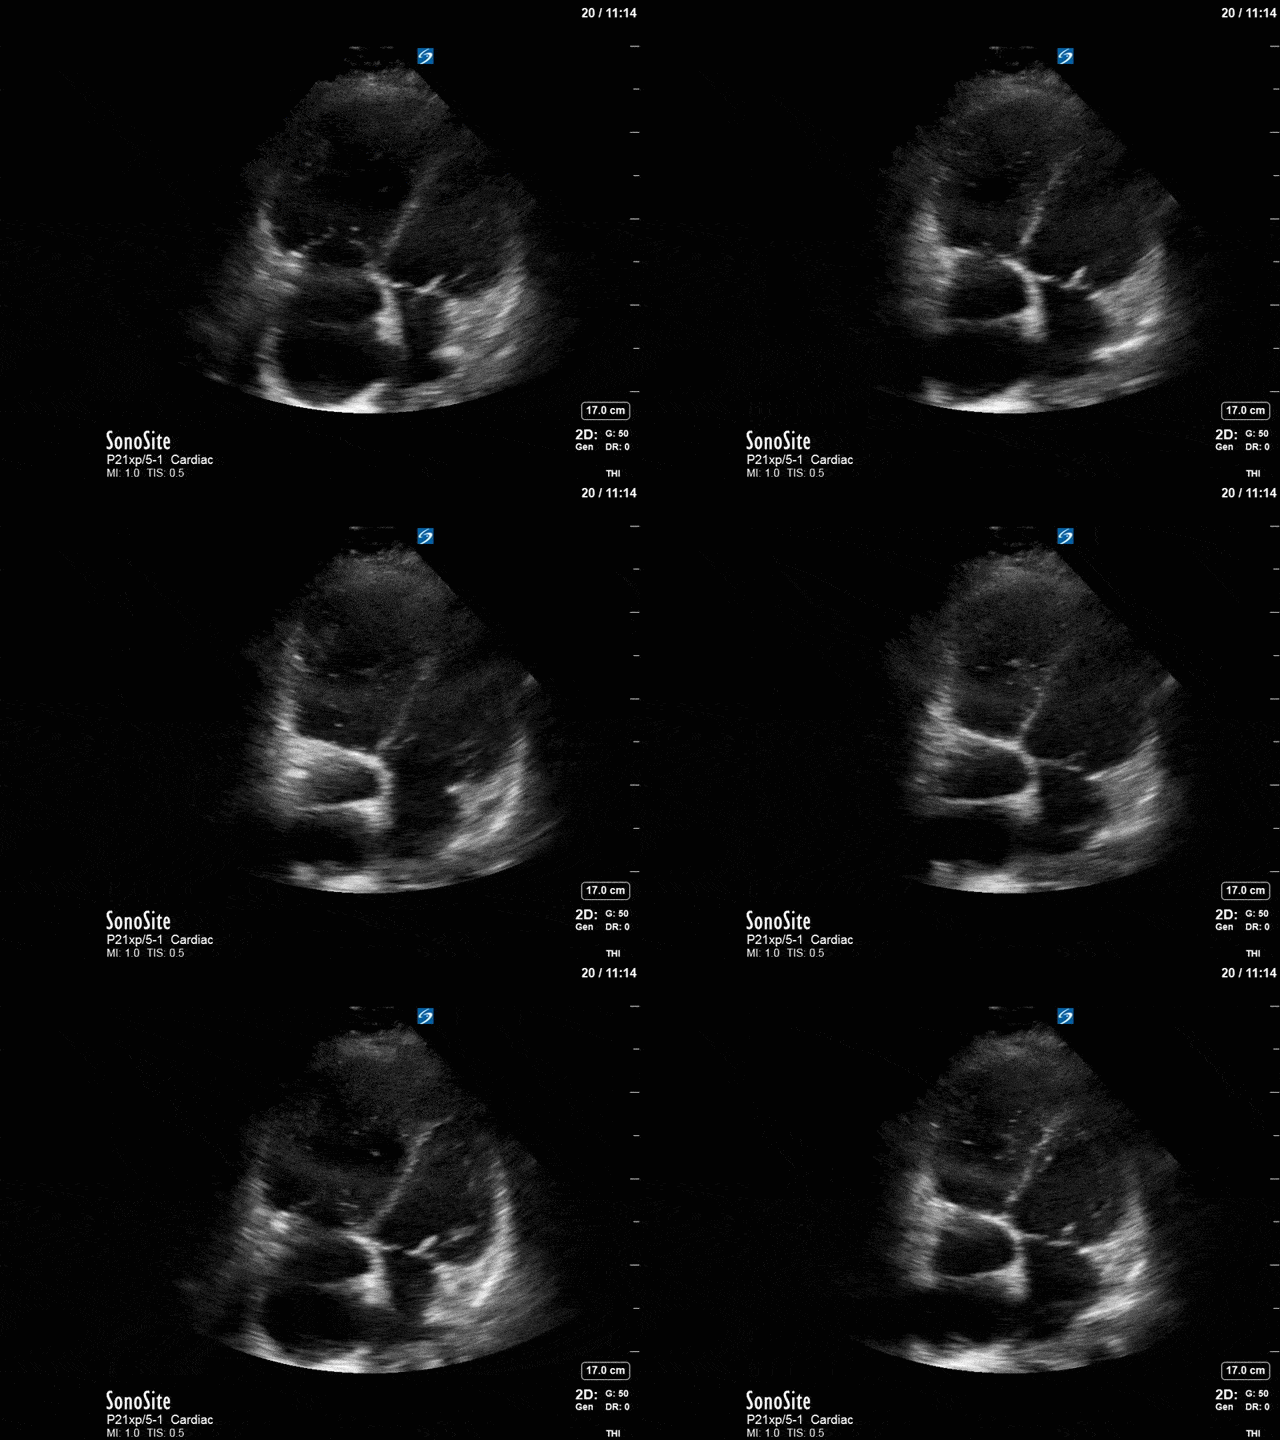
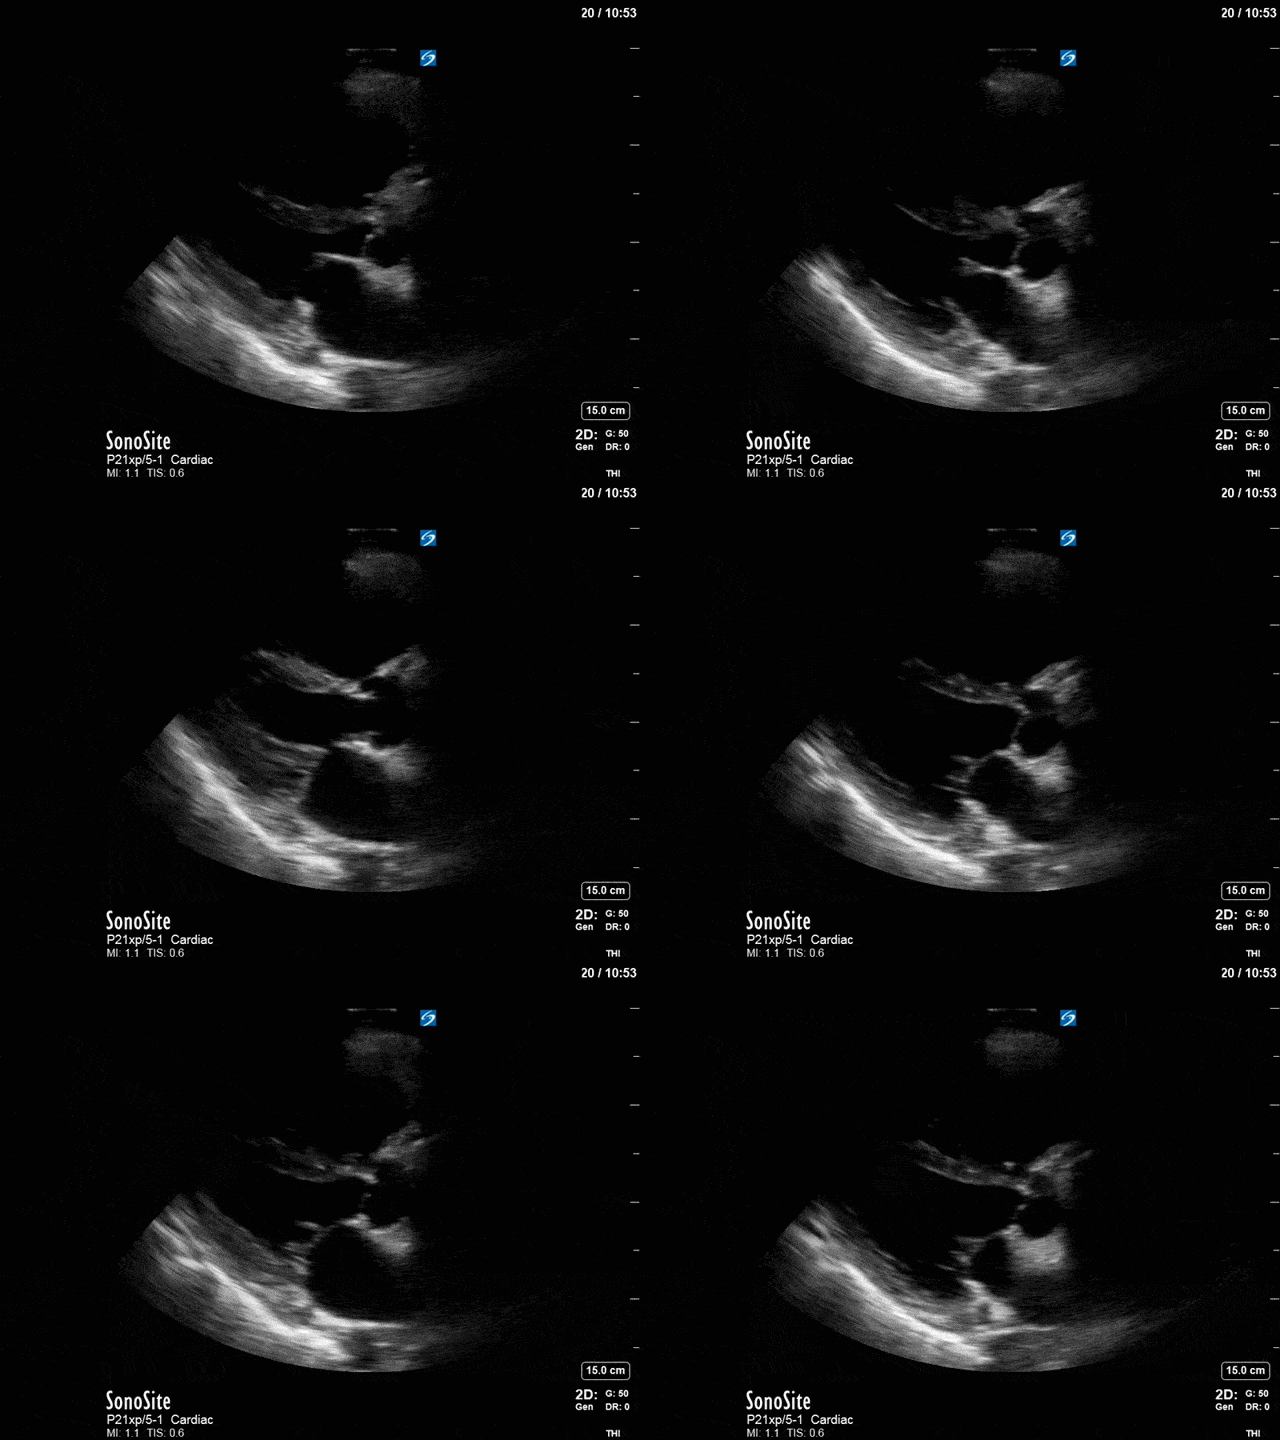
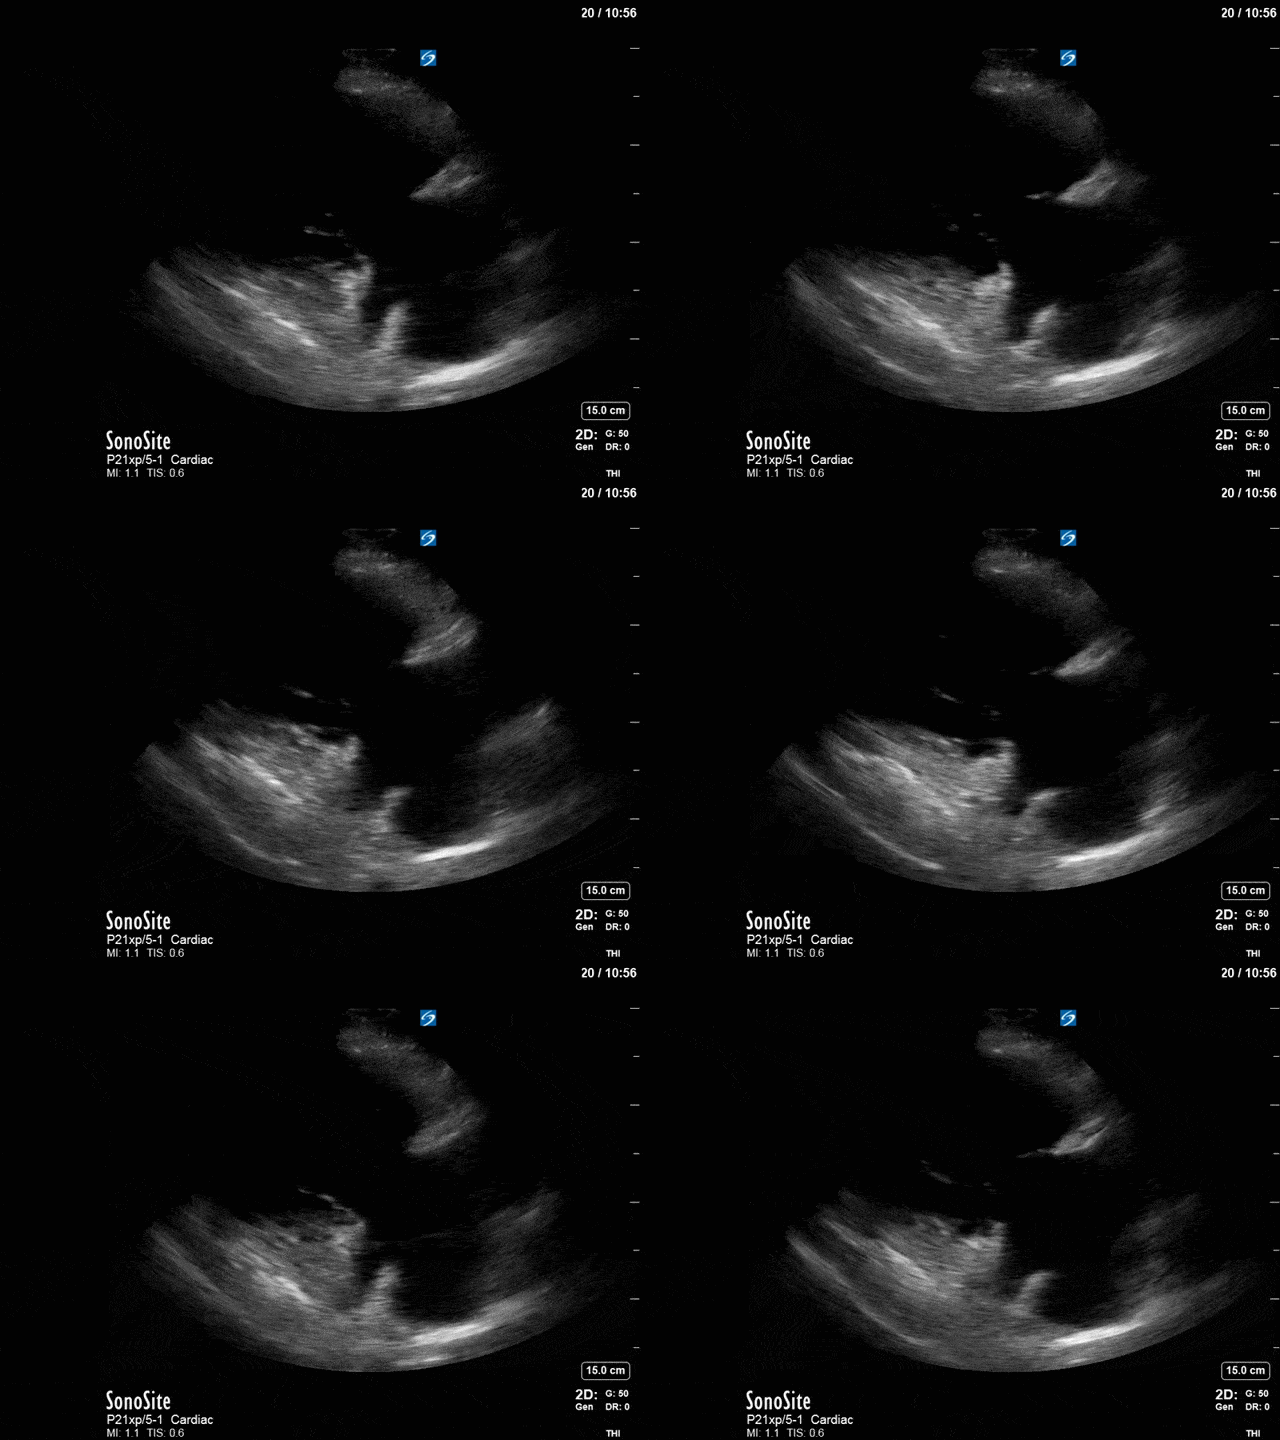
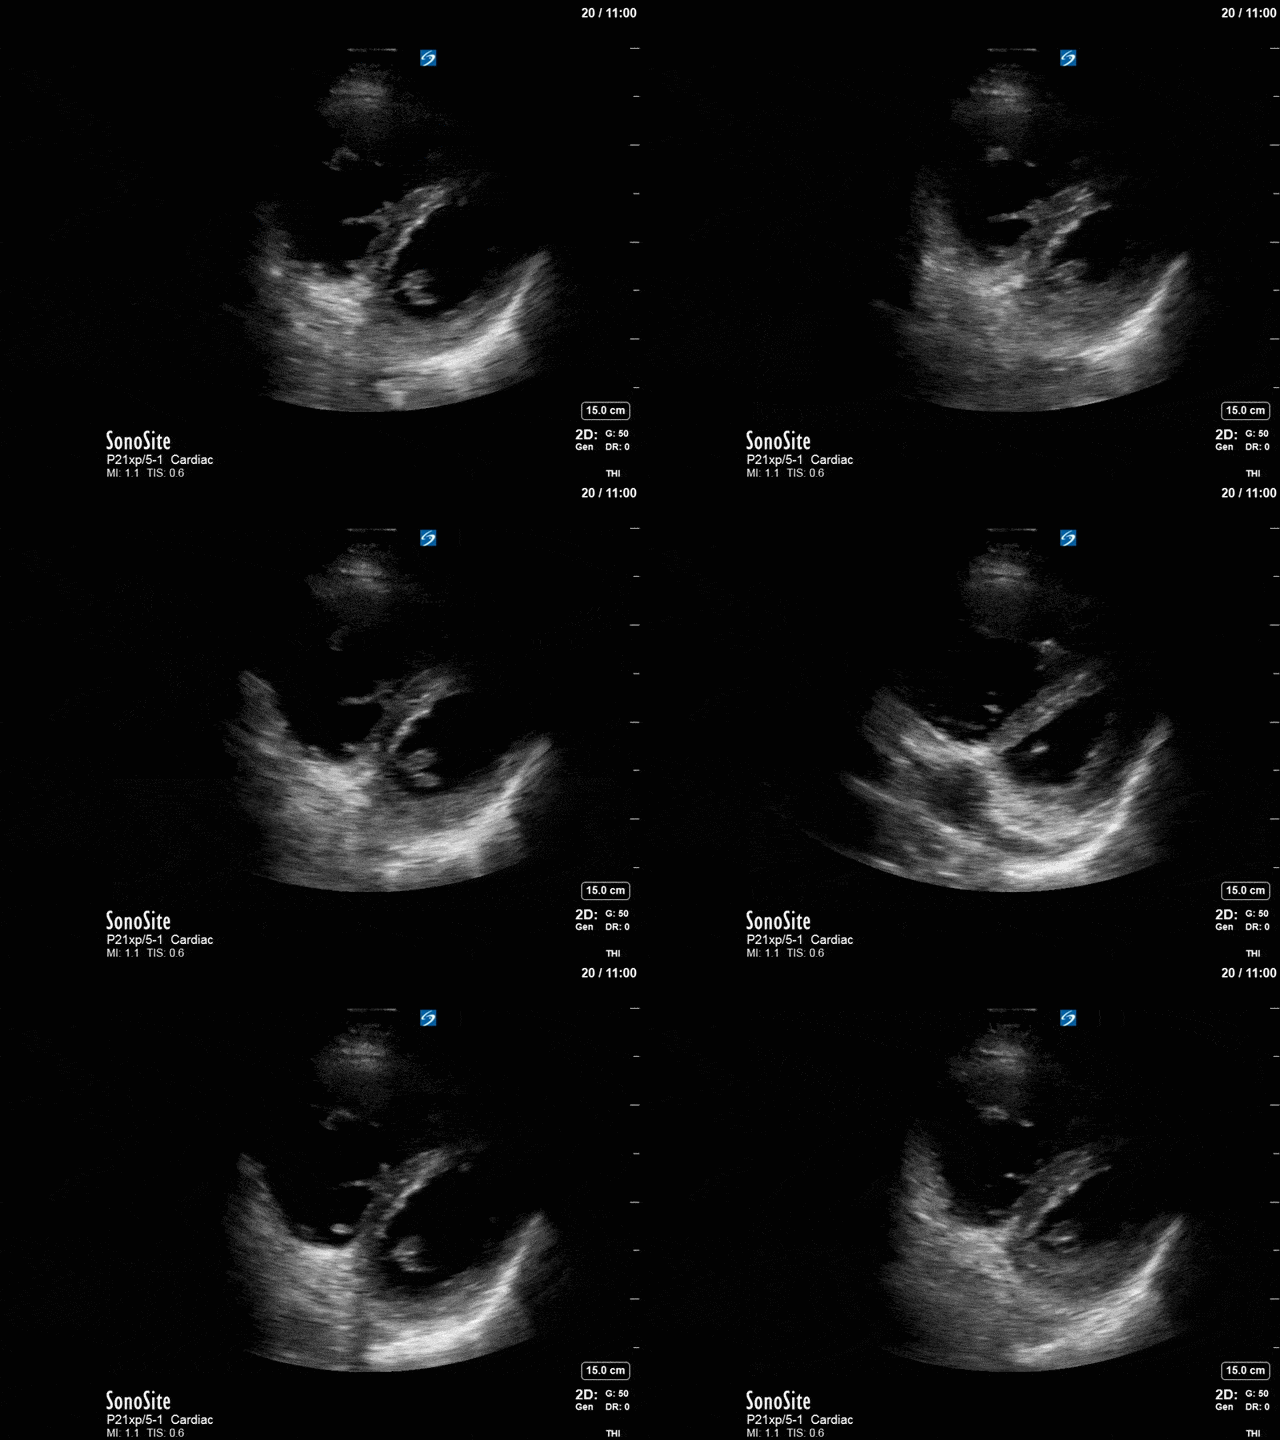
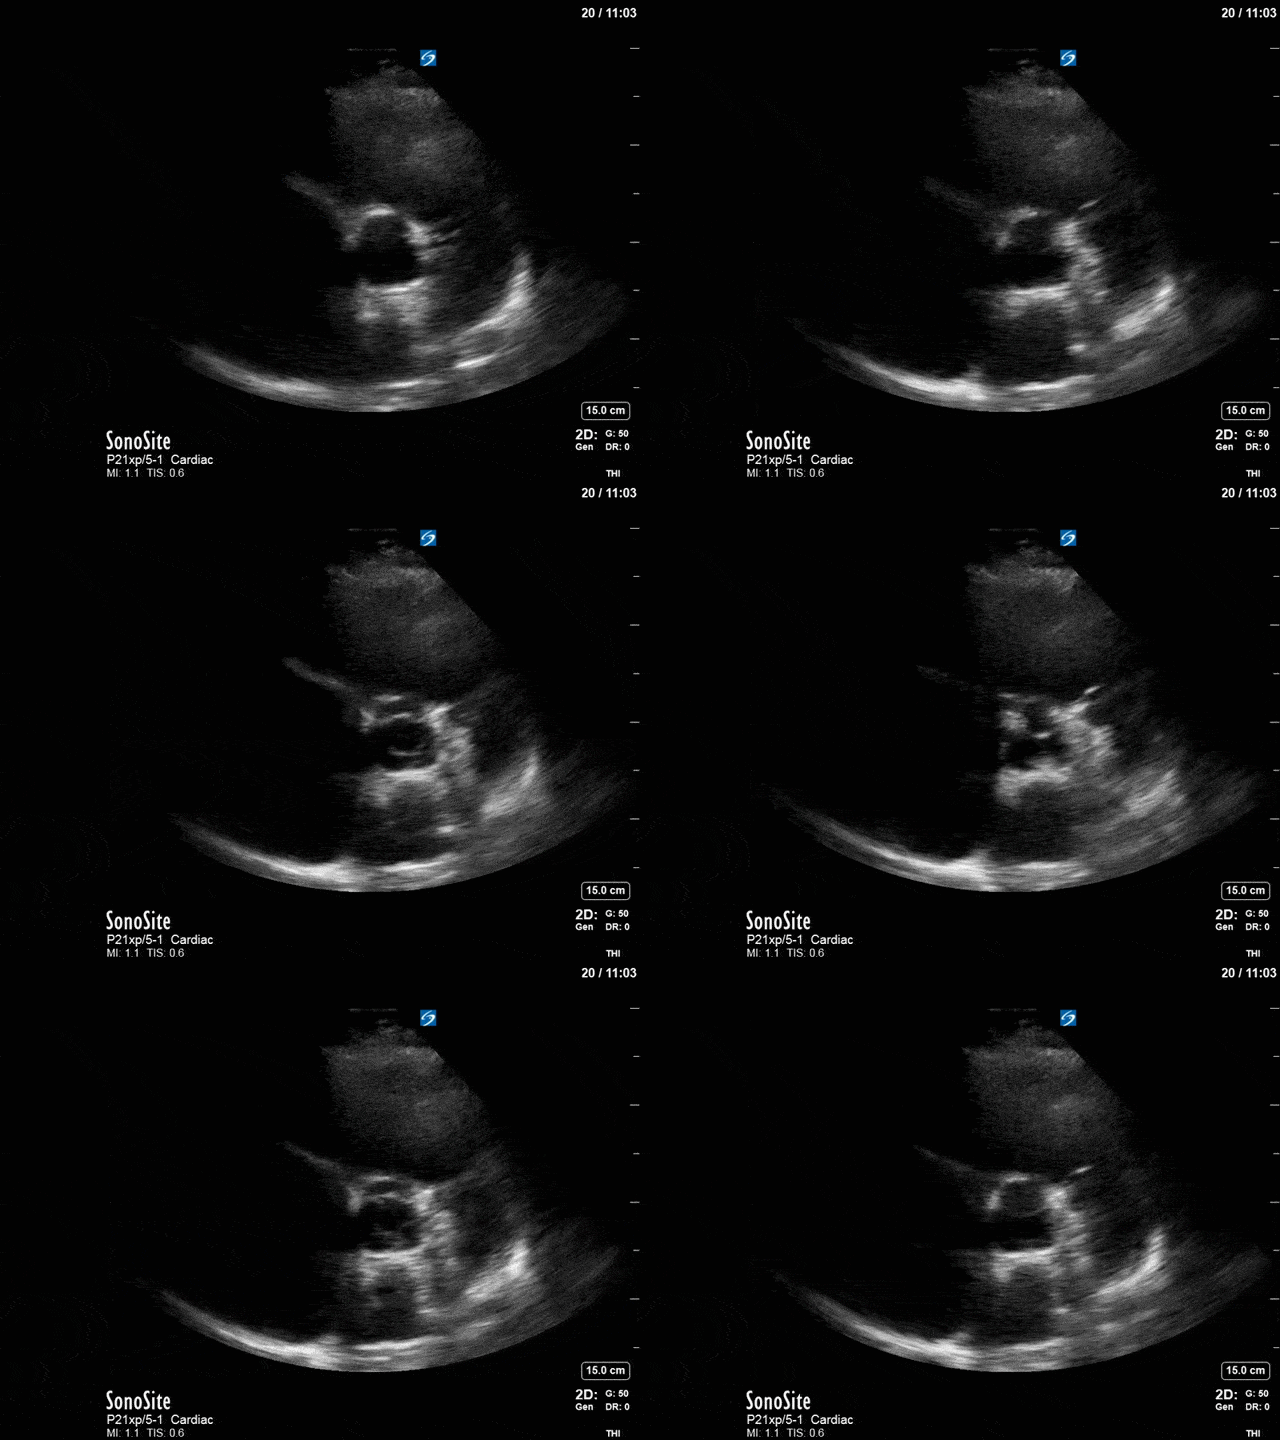
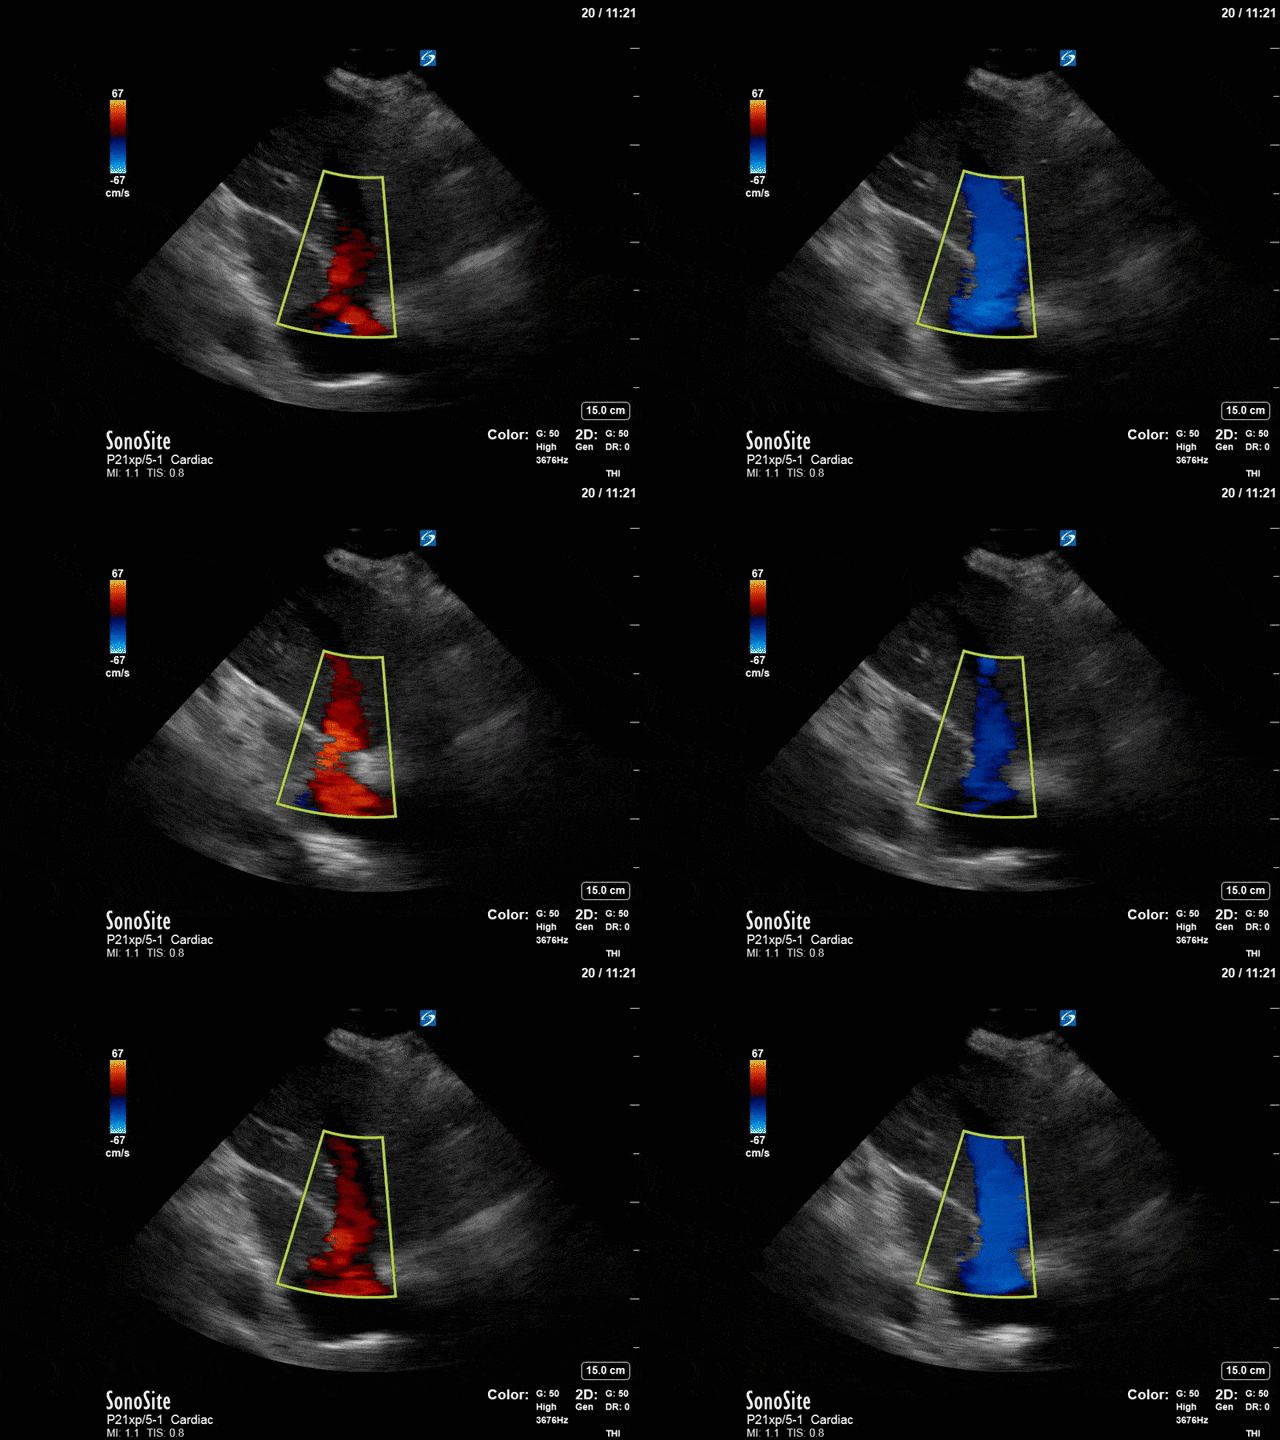
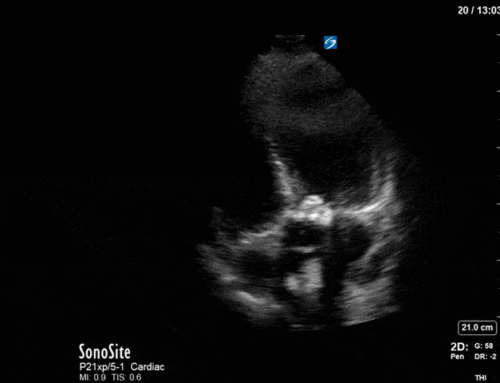
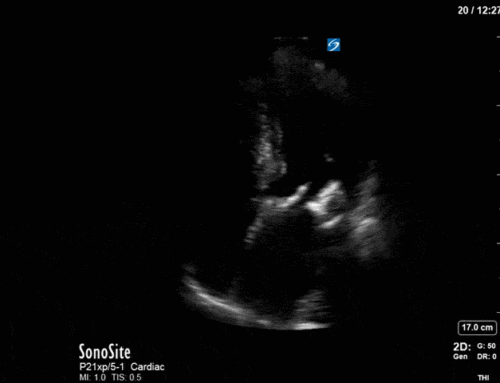
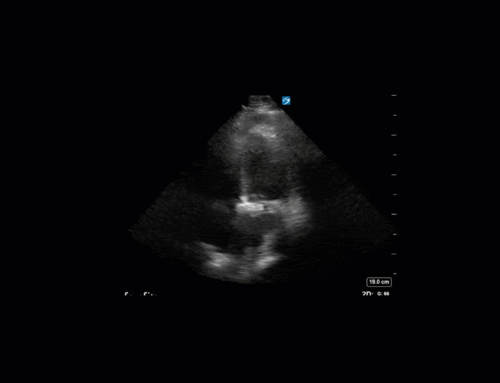
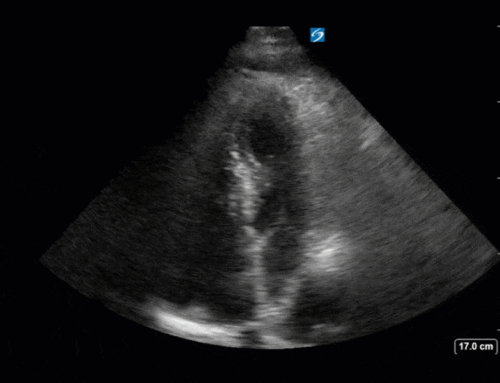
This is an example of severe RV dilation (and RA) and dysfunction. The RV is completely overriding the LV on the apical 4-chamber and in the parasternal short axis you can appreciate the D-shaped septum during both systole and diastole suggestive of both pressure and volume overload.
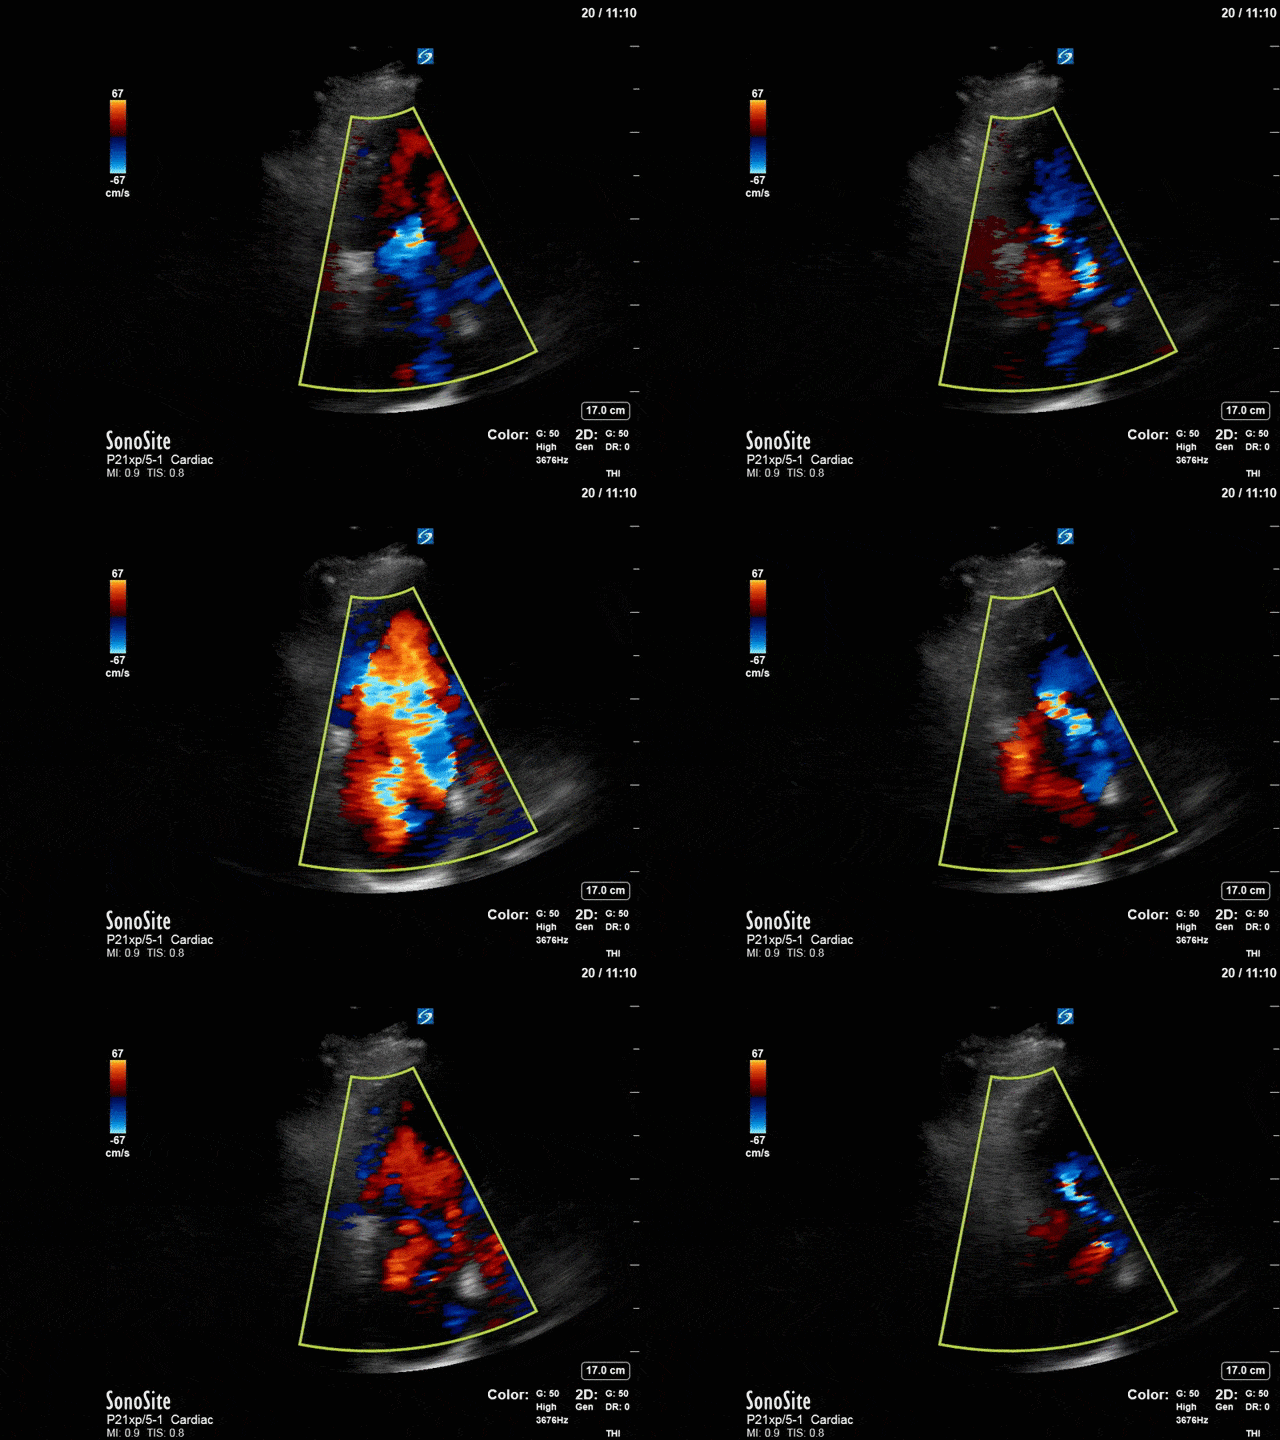
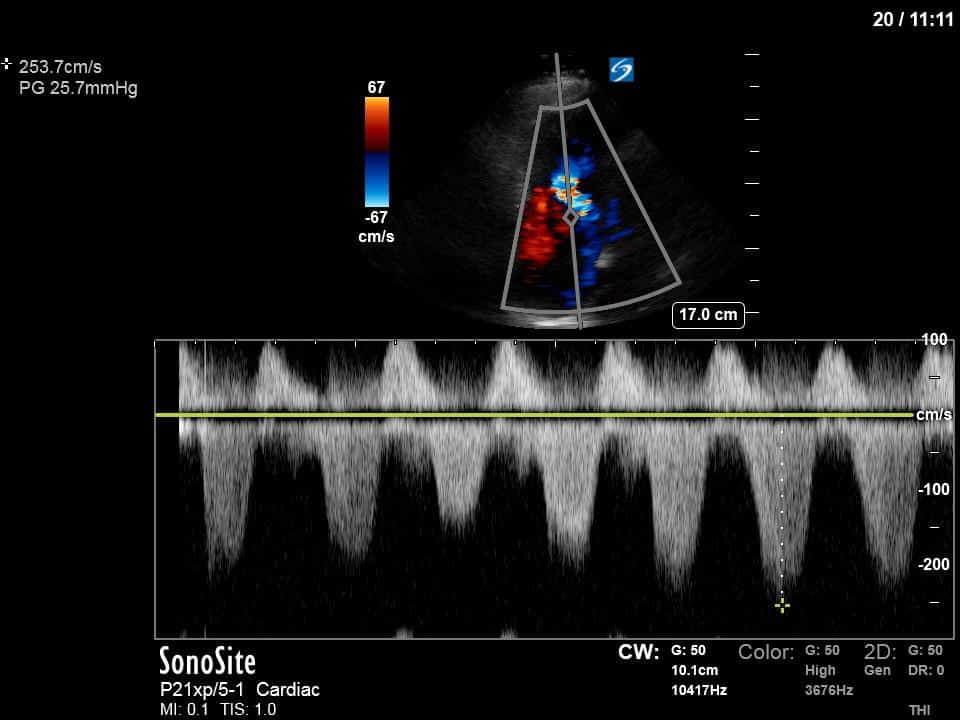
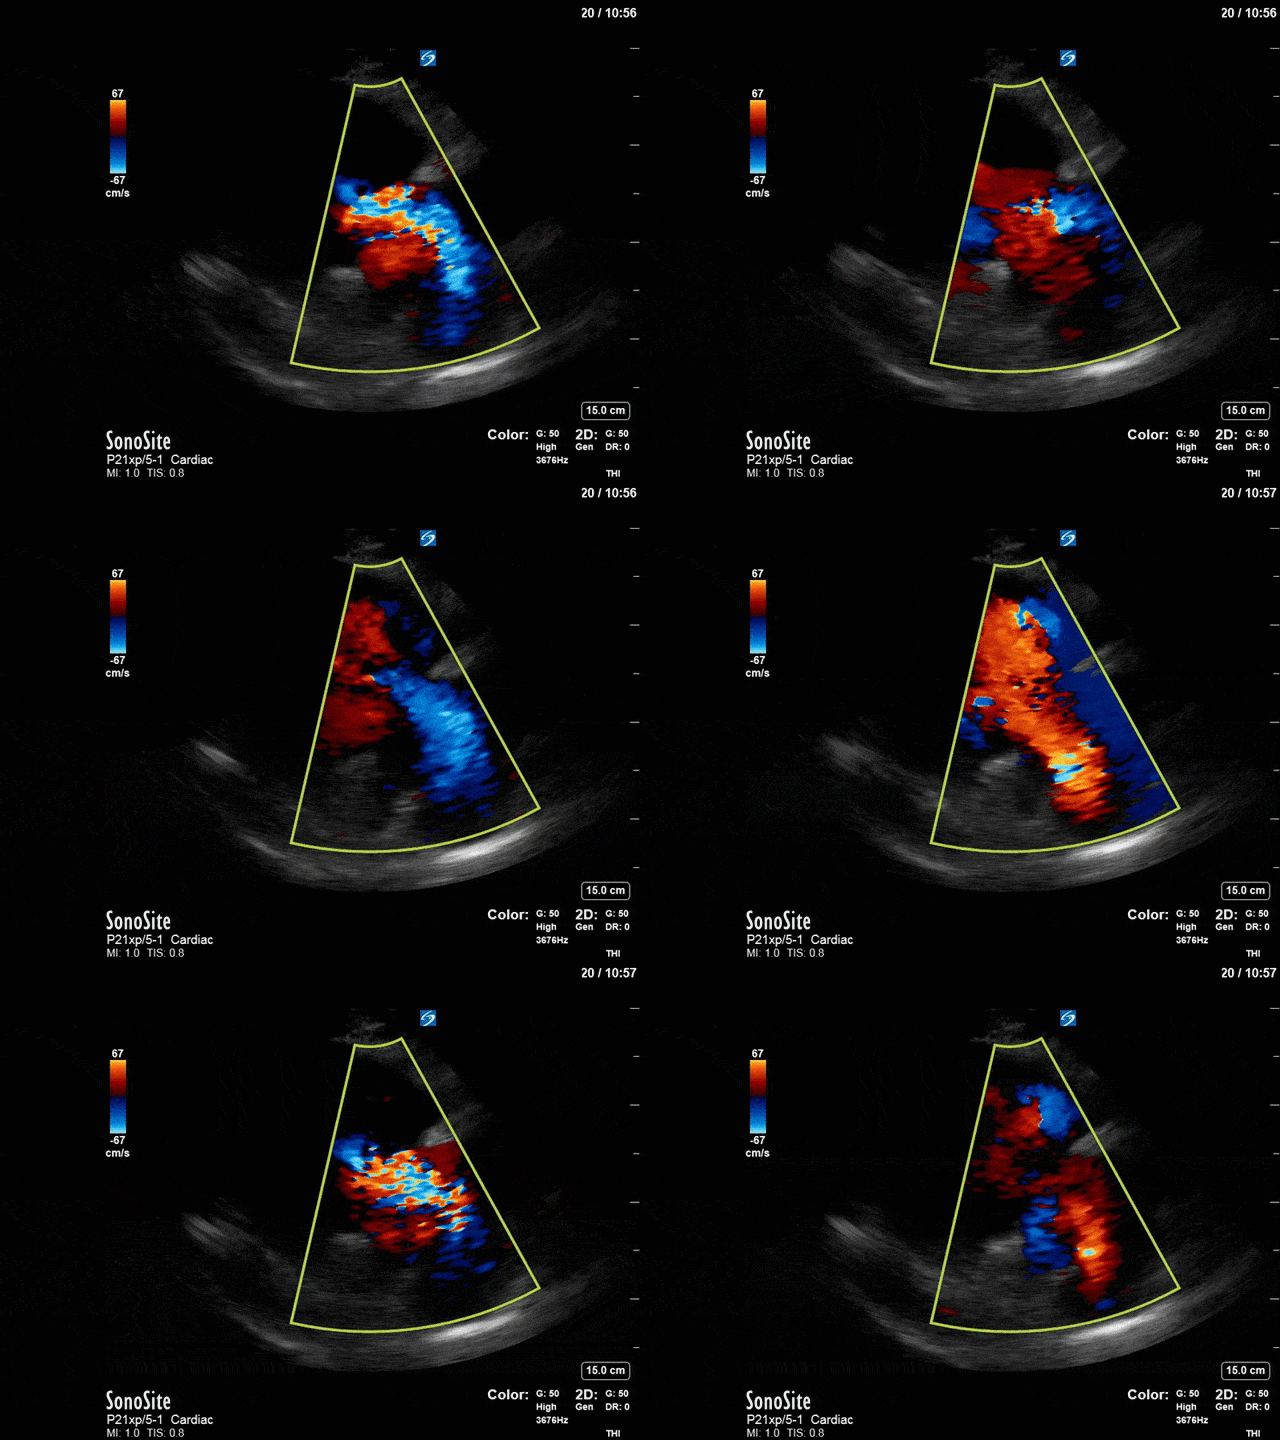
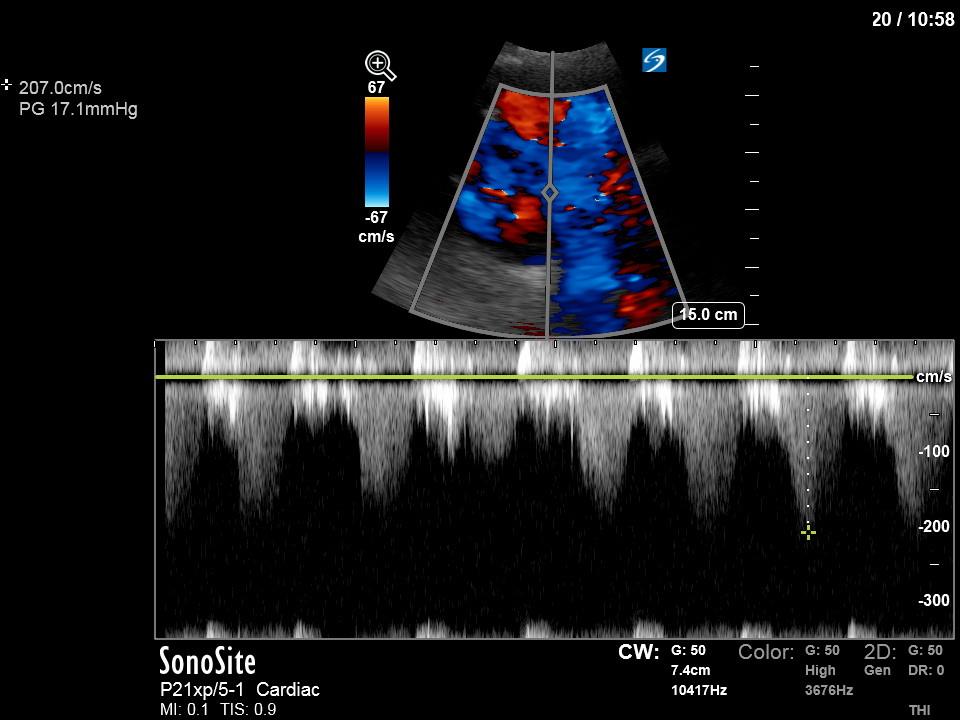
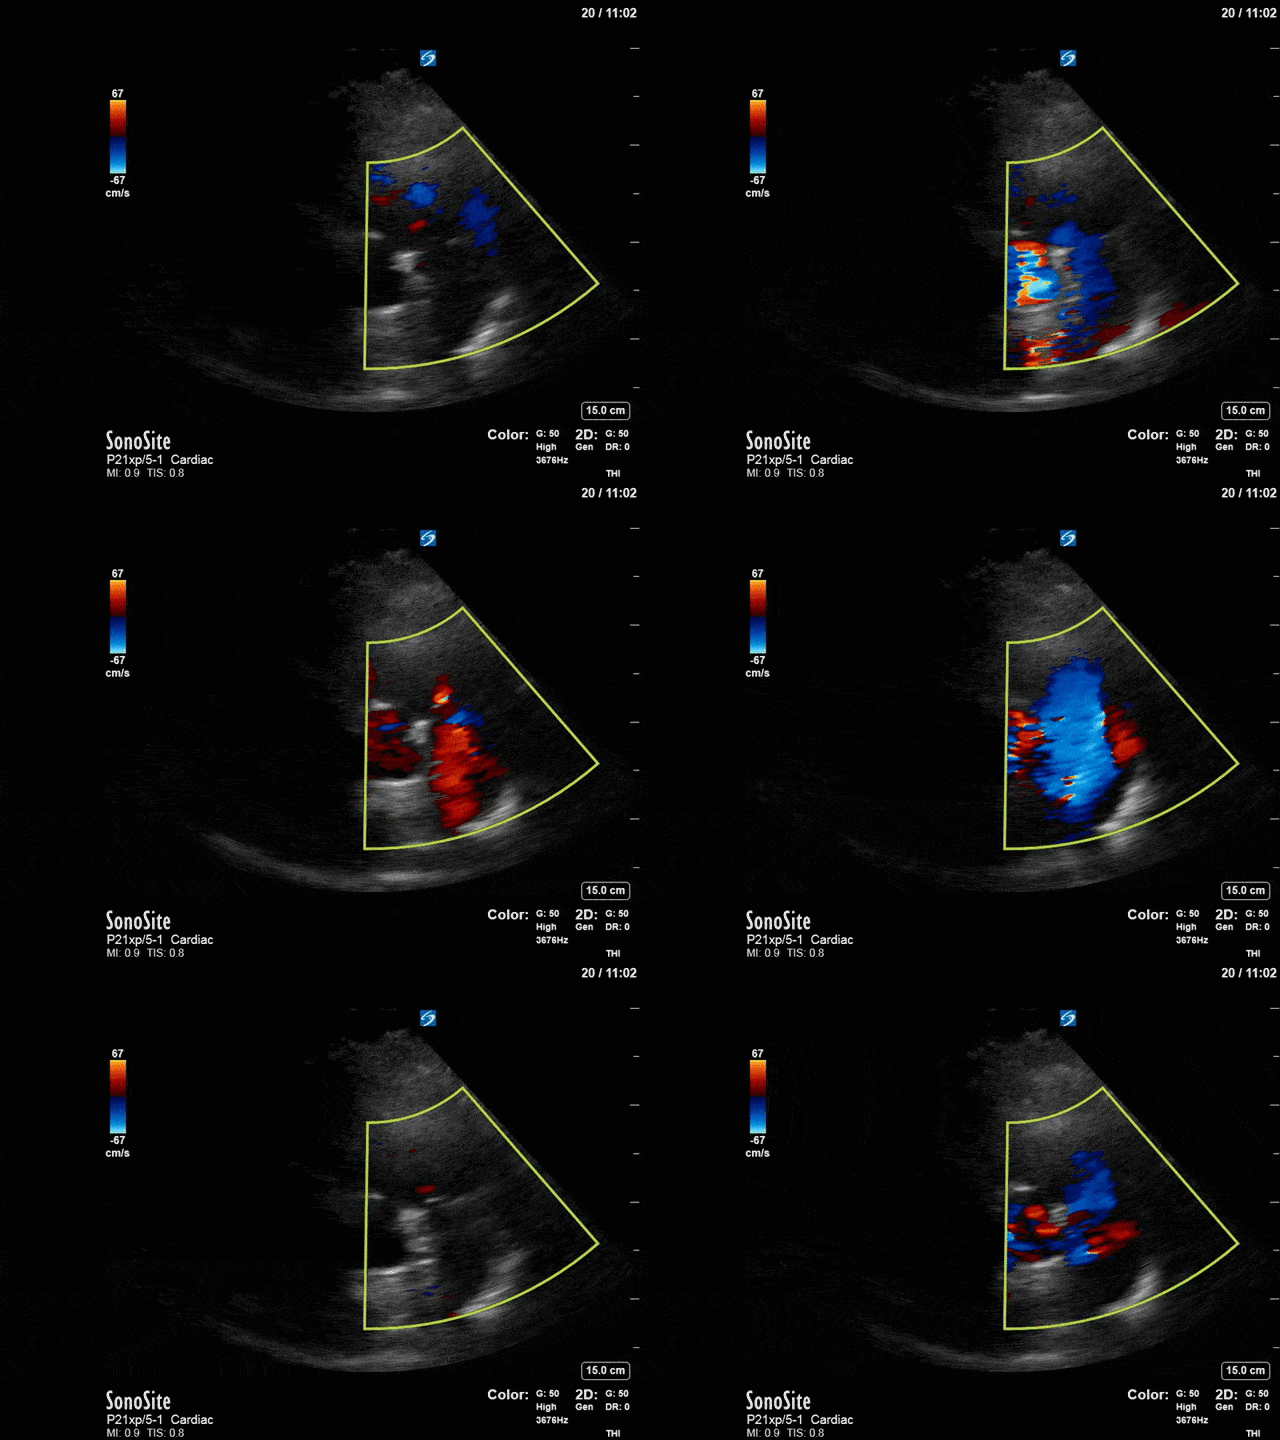
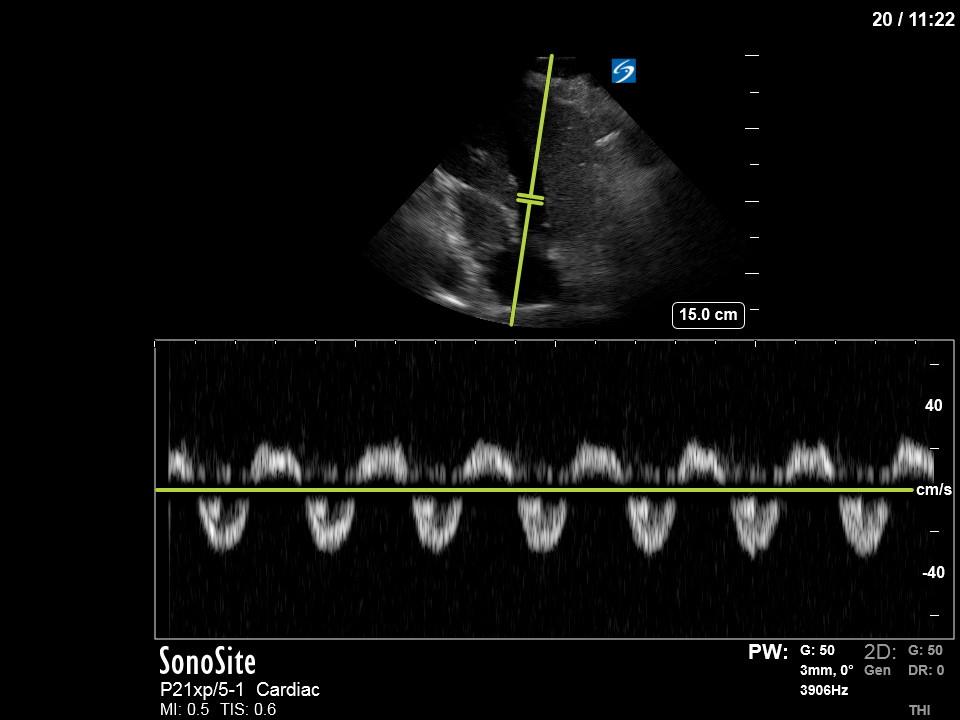
The TR has been interrogated from both the RV inflow window and the A4C window. You can see a large, severe appearing jet, directed towards the septal TR leaflet. There are a variety of parameters that can be used to quantify TR, however, there are several immediate features that suggest this is severe TR without having to resort to some of these more advanced methods. First, using a qualitative analysis of the continuous wave (CW) spectral doppler tracing (from both the RV inflow and A4C windows) shows a highly dense, and at times quite triangular signal. These aspects are both consistent with severe TR. More mild forms of TR are usually less dense and more parabolic in shape. Furthermore, pulse-wave (PW) doppler of the hepatic vein shows systolic reversal of flow which is also suggestive of severe TR.
In this case the importance of recognizing that this is severe TR is that in this setting, the usual way of estimating RVSP can’t be relied upon. Usually, we apply the modified Bernoulli equation () to get the pressure gradient between the RV and RA and then add on the estimated RAP. However, in the setting of severe TR, the right atrial pressure (RAP) will increase rapidly during systole which will result in an underestimation of the RVSP. This is likely the case here as the highest-pressure gradient was only 26. There are also some other, more physics-based reasons, why in the setting of severe TR the simplifications implied in Bernoulli equation itself may break down contributing its inaccuracy.
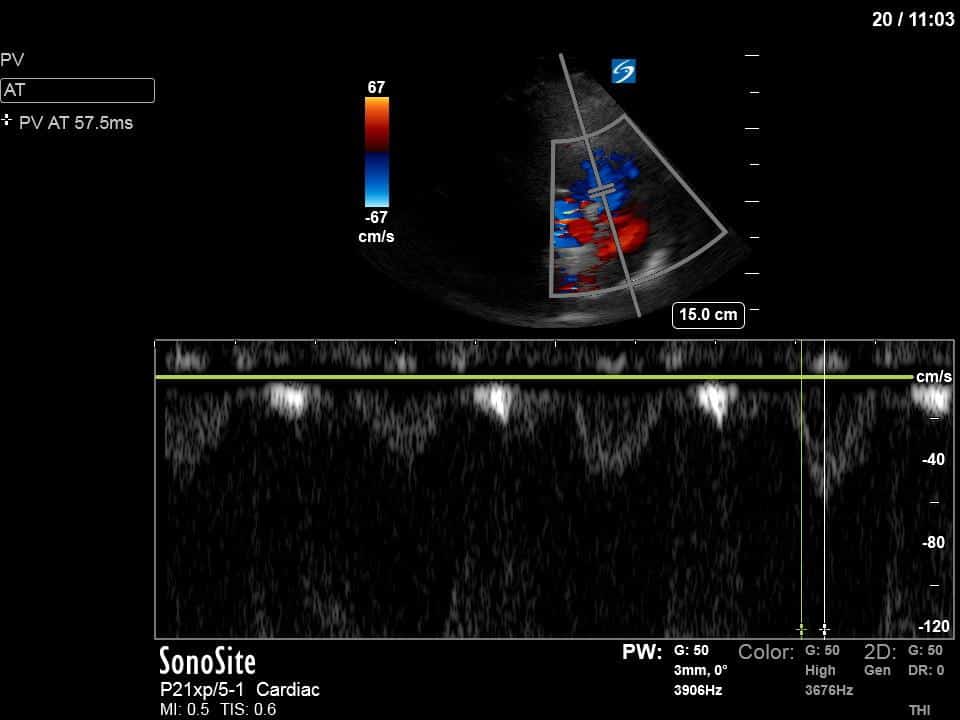
We also interrogated the RVOT with pulse-wave doppler and measured the pulmonary artery acceleration time (PAT). Using this we can also get an estimate of the mean pulmonary artery pressure (mPAP). There are a variety of formulas but a simple one to remember is mPAP = 80 – 0.5(PAT). In this case, the PAT of 57 would yield a mPAP of ~52mmHg. This value is more in keeping with his known severe CTEPH.
Although estimating the RVSP is a great way to quantify the severity of RV pressure overload this case illustrates a potential pitfall of this method and highlights another Doppler technique that can be deployed for this purpose.

