Happy Monday fellow UltraGeeks,
I’m very sad to say that this is my last COTW e-mail for a while. I’ll be back later in 2019 for round two as the ultrasound fellow here at Western, but for now let me say that it’s been a real pleasure to share my love of ultrasound learning with you all each week.
In addition, COTW will be taking a short holiday hiatus after this week – the WesternSono team will be back with more POCUS goodness in the new year. This week’s answers are therefore included at the end of today’s post.
The Case
This was another case with some very impressive POCUS images. With no clinical context, can you determine what we’re seeing here? 
COTG
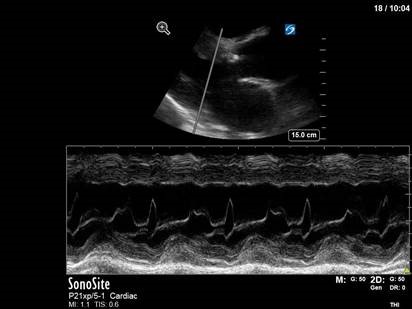
A slightly cryptic puzzle this week. From this single picture – and with no clinical context – what can you tell me about this patient’s heart valves? Hint: you may need you glasses – or the zoom button – for this one.
Eye Scandy
This patient spoiled us with a crystal clear view of her vertebra and spinal canal, found incidentally while doing an abdominal POCUS.
Answer to Last Weeks Case

 This is a fascinating case demonstrating an extreme example of fairly common pathology. It helps illustrate some key principles of ultrasound interpretation: if you’re not sure what you’re seeing, start by finding your landmarks, describe what you’re seeing, and then come up with a list of possible explanations.
In the R flank view, we initially see some liver, and the screen is rapidly taken over by a large, well-circumscribed anechoic structure with evidence of complexity (hyperechoic debris) within its centre. In the L flank view, we see spleen and diaphragm screen left, and then several circular, well-circumscribed, anechoic cystic-like structures, this time without obvious debris within them. Finally, in the midline/peri-umbilical region, we see the screen once again taken up by what looks to be a large, fluid-filled, well-circumscribed structure with some complexity within the anechoic space.
To figure out what’s going on, we can start by ruling things out. This is not ascites, as the fluid collections are well-circumscribed and do not fill geometric spaces. It might be volvulus with bowel obstruction and severe dilation of bowel loops, although we don’t see typical haustra (though these can be lost in severe dilation). This also does not have a typical appearance for tumour or abscess.
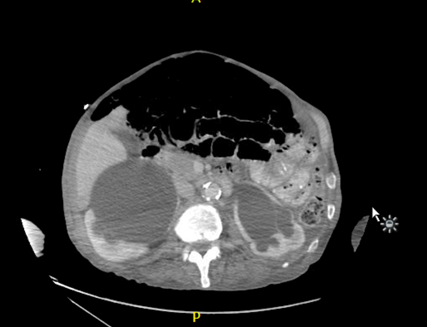
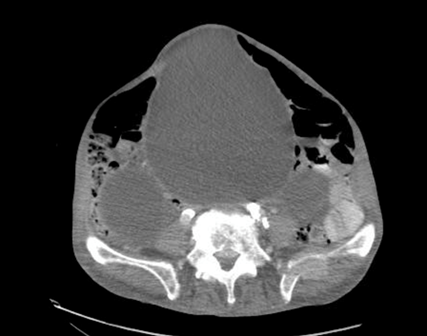
The left flank image is probably the most revealing in the end, given the multiple anechoic spaces and position relative to the spleen. This is extremely severe hydronephrosis with a hugely distended bladder (that’s what you’re seeing in midline). POCUS findings led to a CT, which revealed a new diagnosis of metastatic small cell lung cancer. A couple impressive screenshots from the CT are shown below:
Answer to Last Weeks COTG
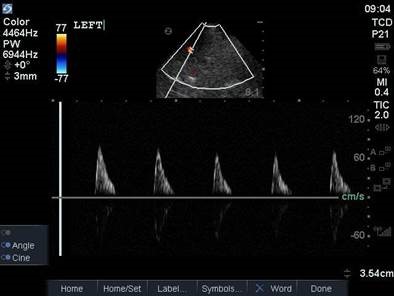
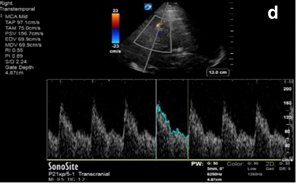
This is a transcranial doppler study done from a left transtemporal window (hint: we’re on the TCD preset as indicated on the top right of the screen). In the first clip we can see blood flow within the MCA with colour doppler that appears to have absent diastolic flow – there is a red flash only in systole. This is confirmed with a PW tracing through the vessel, which shows absent diastolic flow (only isolated spikes in systole, followed by a pause). A normal TCD tracing should, of course, demonstrate blood flow in both systole and diastole, as shown below.
As ICP increases and a patient progresses on a spectrum towards cerebral circulatory arrest, diastolic flow is at first blunted, then absent, and eventually reversed, as shown in the diagram below. We can use TCD to help us non-invasively monitor intracranial pathology in a population in whom neurologic examination is often very limited or confounded.
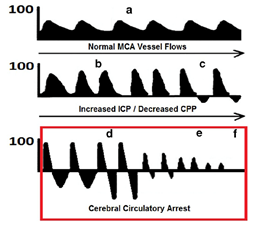
In our patient, TCD revealed pathologic absence of diastolic flow and increased ICP, with decreased CPP (cerebral perfusion pressure). These findings were confirmed with ancillary imaging, and, in conjunction with a consistent clinical exam, a declaration of brain death was made later that day.
The uses of TCD for POCUS providers include monitoring ICP, detecting vasospasm, evaluating for midline shift, and detecting progression towards cerebral circulatory arrest. The figures above are taken from an excellent attached paper from our very own Drs Vincent Lau and Robert Arntfield, for those who are interested in more details.
Answer to This Weeks Case
This is another fun POCUS case where a simple, stepwise interpretation technique can help you make sense of an unusual image. This is a thoracic scan, and this image is taken on the left side in the anterior axillary line around the line of the nipple (also known as “L2” or “LAAXL”). Screen right is diaphragm – which is quite elevated to be seen at this level – with spleen underneath it. There is a pleural effusion represented by the black anechoic spaces. A small amount of very compressed, slightly hyperechoic lung tissue is seen flapping around at the bottom of the screen, creating a nice little jellyfish sign.
The elephant in the room – or the chest, in this case – is the large, well-circumscribed, circular, heterogenous structure seen screen left. We can easily say that this is NOT normal, given that we’re in the lung and would expect typical lung artifacts (A/B lines) in normally aerated lungs. We can also say that this does not have the appearance of consolidated lung, though it does have a heterogenous texture that we sometimes see in hepatized lung, as it is too circular.
In fact, what we’re seeing is a very large neoplastic mass. The most common etiology for a mass of this size would be a primary lung cancer. In this patient’s case, the oncologic diagnosis is still unclear – possibly thymoma vs an aggressive lymphoma or leukemia.
Answer to This Weeks COTG
This one’s really just a fun little party trick. This is an M-mode image through the anterior leaflet of the mitral valve taken in a parasternal long axis, which we typically use to measure EPSS (E-point septal separation) as one surrogate of LV function. In this image, however, a subtle characteristic of the M-mode tracing gives us a clue as to what’s going on in the rest of the heart. Notice the jagged, or fluttering, appearance of the trace of the anterior mitral valve leaflet on this zoomed-in shot.
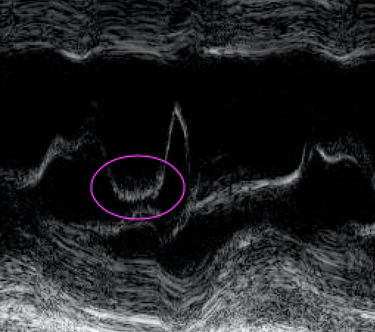
This subtle finding is caused by a severe eccentric regurgitant jet from the aortic valve hitting the anterior mitral valve leaflet in diastole. The turbulence causes characteristic fluttering of the AMVL that can be nicely captured on M-mode – you get serious POCUS nerd points for pointing this one out.
The patient in question in this case had severe eccentric aortic regurgitation secondary to a bicuspid aortic valve, as shown below.
That’s all she wrote. Happy scanning everyone!
The POCUS Team