It’s the end of the block here at Western, so big thanks to our rotators – John Landau, Nick Packer, and Matt White – for a fantastic month of ultrasound learning.
The Case
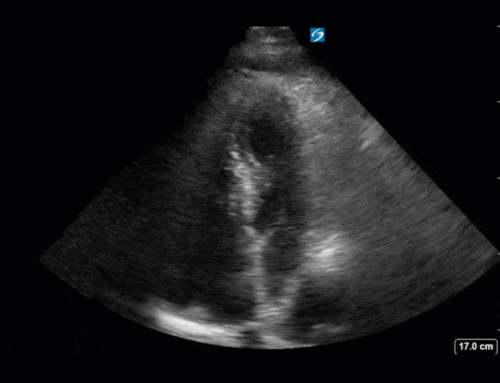
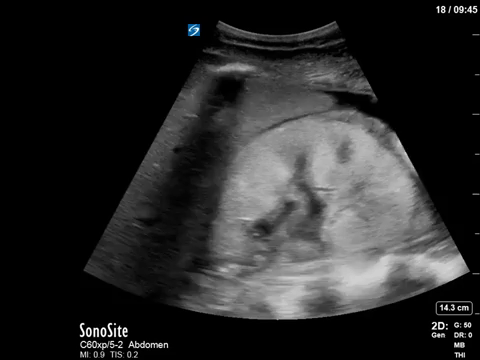
I give you “A Tale of Two Kidneys.” This week we have renal scans from two separate, unrelated patients; but both have interesting findings. What do you see?
COTG
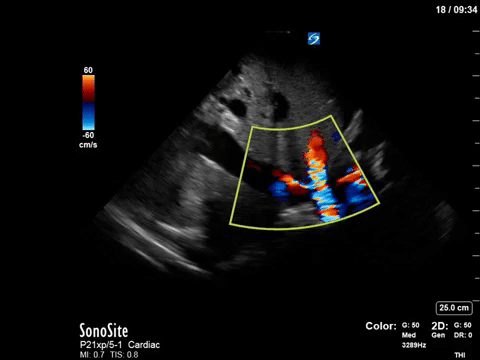
This one is for the true sono-nerds. Without any clinical context, what do the following images tell you about this patient?
Eye Scandy
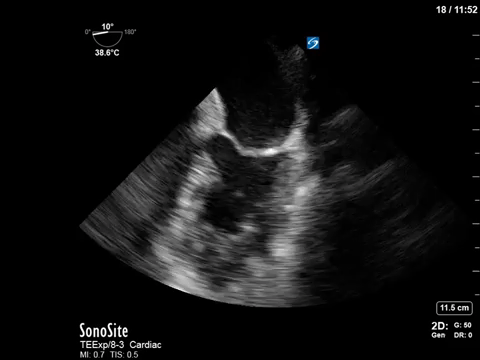
It’s not every day you get an up-close view of a heart re-starting. This was an intra-arrest TEE performed in the unit, with the transition from Vtach to sinus rhythm (with defibrillation) captured on screen. Super cool stuff.
Answer to Last Weeks Case
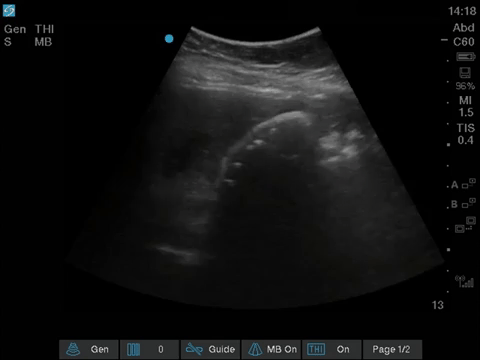
Here we are in a RUQ view, and we can see the liver screen left. There is a hyperechoic curved line the centre of the screen that looks like it might be gallbladder wall; however, we can hardly see the gallbladder itself. This is because it’s actually chock full of stones – notice the bright, hyperechoic elements tucked within the gallbladder wall. The reason we don’t see the rest of the gallbladder, with its characteristic anechoic lumen, is that the bright stones create shadowing – a defining characteristic of cholelithiasis. Here, the stones are so numerous that the posterior shadows obscure the rest of the gallbladder completely!
Needless to say, this scan solved the mystery of this patient’s recurrent abdominal pain; and she went on to be referred for cholecystectomy.
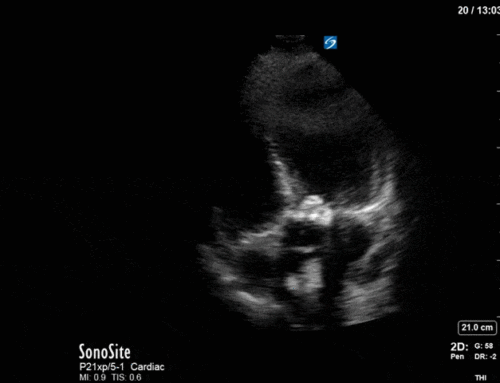
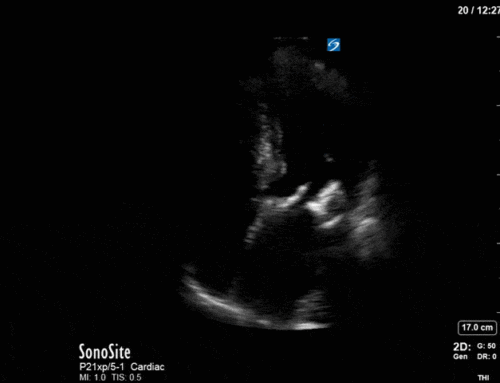
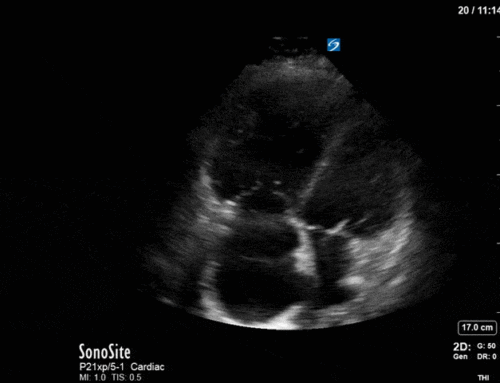
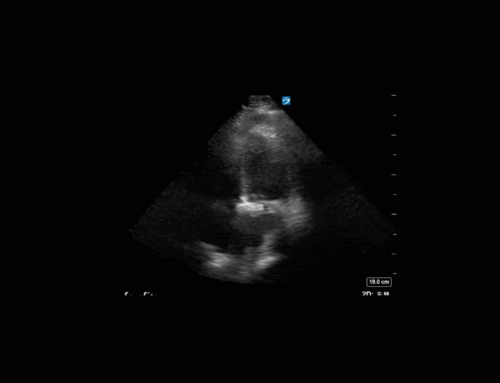
Answer to Last Weeks COTG
Alright, there’s a LOT going on in this scan. This patient has evidence of mitral regurgitation, mitral stenosis, aortic regurgitation, and aortic sclerosis. Let’s take these one at a time.
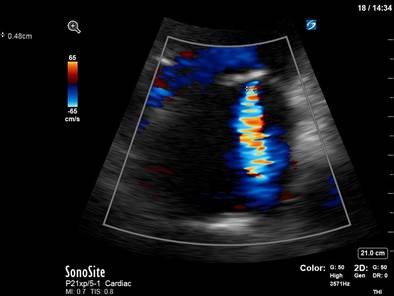
From the 2D clip, we can appreciate that there is evidence of mitral regurgitation. Most often in point-of-care echocardiography, we assess MR qualitatively, using an estimation of jet size relative to the LA (jets occupying > 40% of the LA are usually severe) to identify severe MR. Beyond this, there are numerous ways to actually quantify MR within the world of diagnostic echocardiography. To cover them in detail is certainly beyond the scope of this email – and beyond the scope of point-of-care scans – but as a starting point, measuring the vena contracta (VC) is fairly easily done (as long as your image quality and machine resolution is sufficient), and can be useful. The vena contracta is defined as the point in a fluid stream where the diameter is at a minimum. In MR, it is the narrowest point of the jet just as it emerges from the mitral leaflets. Here it is measured at 0.48cm, putting her MR into the moderate category – which fits with a visual qualitative assessment.
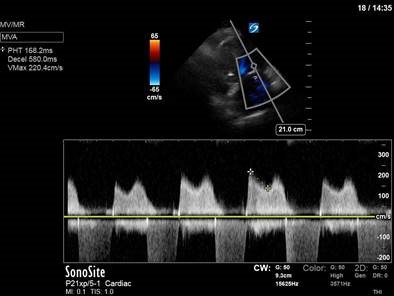
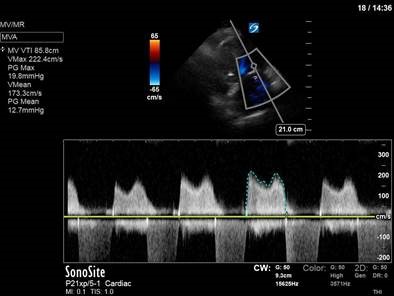
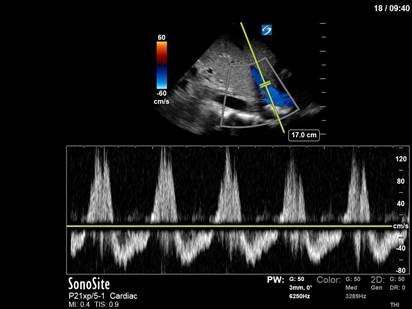
To quantify her mitral stenosis (as with any stenotic lesion), spectral doppler is essential. Here we have put PW over the mitral outflow just past the tips of the mitral leaflets. From the resulting tracing we can measure both a pressure half-time (PHT) and a VTI (to get mean/peak gradients). PHT is a measure of how quickly pressures equalize between two chambers. In mitral stenosis, it is defined as the time interval in milliseconds between the maximum mitral gradient in early diastole and the time point where the gradient is half the maximum initial value. In more severe MS, it takes MORE time for blood to flow through a narrow opening; and therefore, more time for the pressure gradients to equalize. In MS, a PHT of > 150ms is considered severe. From her VTI measurement we can also see that the mean pressure gradient across the mitral valve is 12.7mmHg. Both of these things place her MS in the “severe” category.
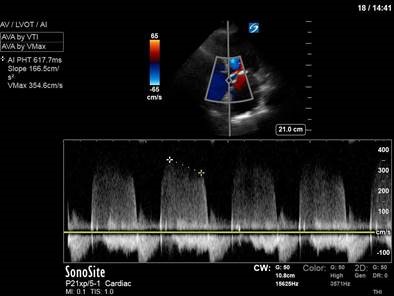
Moving on to the aortic valve, we once again use a PHT to quantify aortic regurgitation. In contrast to a severe stenotic lesion – in which a more severe lesion produces a longer PHT – a severe regurgitant lesion will allow pressure gradients to equalize more quickly between two chambers; therefore producing a shorter PHT. For aortic regurgitation, a PHT of < 200ms is severe; hers is 617ms, which is consistent with mild AR. Again, we can be reassured that this seems consistent with our visual appreciation of the regurgitant jet from the colour doppler clips.
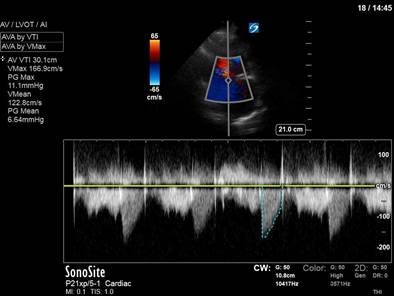
Finally, given that the aortic valve looked bright and calcified, we looked for gradients across the aortic valve that might indicate aortic stenosis. A CW trace was used, which revealed a mean PG of 6.6mmHg and a Vmax of <2m/s – consistent with aortic sclerosis rather than stenosis.
Taken together, these findings show moderate MR, severe MS, mild AR, and aortic sclerosis. Given her presentation with recurrent flash pulmonary edema, the severe MS is our clinical culprit.
Evidently, comprehensive valve assessment is a huge topic. The role of POCUS in valve assessment is fluid and highly dependent on operator expertise, machine capabilities, and clinical situation. The line between POCUS and diagnostic echocardiography is not clearly defined, though an attached paper by Scott Millington and Rob Arntfield covers a reasonable approach to valve assessment for the advanced critical care echocardiographer. For those who want even more detail as a point of reference, the ASE (American Society of Echocardiography) guidelines for evaluation of regurgitant and stenotic lesions are also attached.
millington arntfield 2013 – valves doppler R heart
ASE2017VavularRegurgitationGuidelines
ASE 2009 valve stenosis guidelines
That’s it for this week – and if you make it through all that, you deserve a POCUS medal! Happy scanning folks..
The POCUS Team