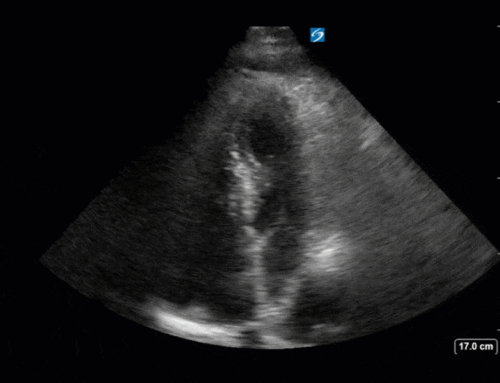
The Case:
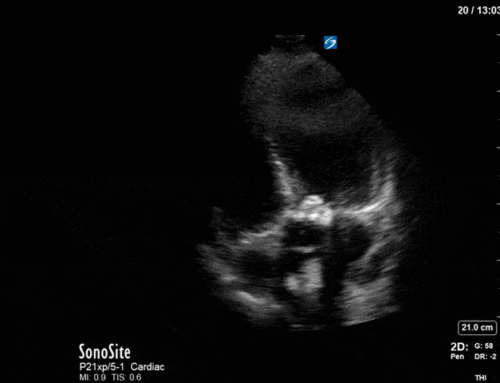
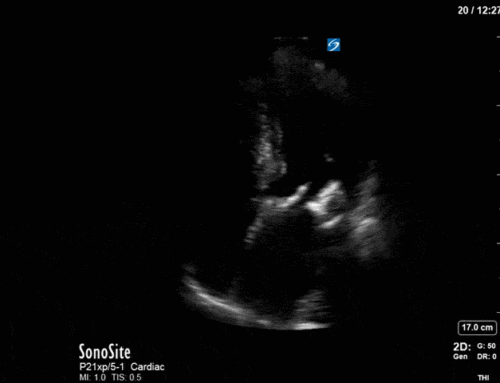
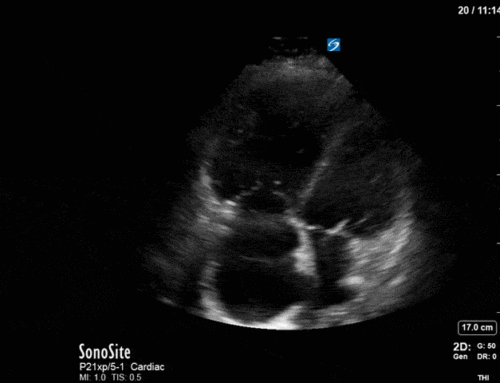
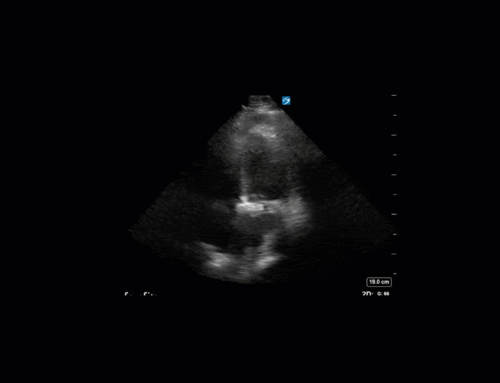
A 62M patient with ascites requires paracentesis. POCUS is performed to help landmark. What do you think of these images? Is there ascites present? Is this a safe location to perform paracentesis? If not, why not?

COTG:
A patient post MVC with C-spine injury and tracheostomy. Here are an M-mode image and 2D clip of the diaphragm while on trach mask trial. What do you think?

Answer from last week:
Last week we presented the case of a 58M post-arrest. These clips are phased array (cardiac probe) images of the lung. For some clinical context – there was significant palpable subcutaneous emphysema on the left side. On the first image, there is a lot of movement as the sonographer is sweeping across the chest looking for rib shadows to try and find the pleural line. On the second clip, you can see the pleural line on screen right, deep to the subcutaneous emphysema, with a very clear lung point. This case demonstrates the appearance of subcutaneous emphysema and highlights the need to see typical landmarks (i.e. rib shadows on either side of the pleural line) before drawing conclusions about underlying lung artifacts.

The Clip of the Geek:
This post-arrest patient (not the same as the first). Had TEE for cardiac assessment given limited transthoracic windows. The striking finding on this study was the significant calcification of the aortic valve with limited valve opening. There are several ways to assess the severity of aortic stenosis and in this case, we attempted to capture the dimensionless index. The dimensionless index is calculated by taking the ratio of the LVOT VTI (measured using PW Doppler) to the AV VTI (measured using CW Doppler). A ratio of <0.25 is in keeping with severe aortic stenosis. Here the ratio is 0.18 (9.75/52.9 = 0.18). The valve area was also calculated at 0.87cm^2 and matched the trace area of valve opening (see, the math works!)


